What European software job posts leave unsaid
By WiseWorld
What soft skills do European software engineer job posts actually name? We read 563 LinkedIn postings from ten capitals and mapped each to the WiseWorld PowerWheel (44 soft skills). Collaboration appears in four of five posts (81%); Written Expression ranks 14th (12%). Counts run from what employers write through city and company splits to the gap between the post candidates read and the scorecard interviewers use.
About this data story
What soft skills appear most in European software engineer job posts?
Collaboration appears in 81% of posts, followed by Task Mastery (70%), Accountability (61%), Flexibility (60%), and Dependability (54%). Written Expression ranks 14th at 12%. Based on WiseWorld PowerWheel analysis of 563 unique LinkedIn job posts across ten European capitals (July 1, 2026).
Picture a candidate on a Tuesday evening, rereading your job post for the third time. They know what they would build. What they cannot picture is how they are supposed to work with the team: "strong communicator," "team player," "comfortable in a fast-paced environment." Those lines shape who applies and what they rehearse before the interview. They rarely show what a good week actually looks like.
We wanted to see what European employers write when nobody is yet sitting in the interview room. So we read 563 unique LinkedIn job posts for software engineers across ten European capitals (Brussels, Berlin, Paris, Rome, Madrid, Warsaw, Amsterdam, Vienna, Prague, and Stockholm), from 296 employers. As you read, keep one of your own posts open beside this page: which human skills do you name clearly, and which do you leave for candidates to guess?
The collection story has a twist. We pulled 1,000 posts, one hundred per city. Only 563 were different jobs. Eighty-six remote roles had been listed again and again across city searches, producing 437 duplicate listings. One opening could look like ten local jobs depending on where someone searched. Market charts count each job once so a handful of repeated remote roles do not skew the averages. City charts keep all one hundred posts per capital, because that is what a job seeker actually sees when they search locally.
We also ran the same lens on 4,920 pharma job posts from large employers, so you can compare software and pharma on the same wheel later in this article.
The PowerWheel is WiseWorld's map of 44 soft skills in six groups: teamwork, communication, thinking skills, work ethic, problem solving, and leadership. The farther a skill sits from the centre, the more often posts named it.
Start with the snapshot of what we collected:
European software hiring study at a glance
563 unique LinkedIn job posts from 296 employers across ten European capitals, July 2026.
- Source: LinkedIn job posts for software engineer roles in ten European capitals
- Jobs read: 1,000 collected, 563 unique after deduplicating by job ID
- Companies: 296 employers (two-thirds posted only one role)
- When posted: 12 June 2026 to 1 July 2026 (LinkedIn posted date on each listing)
- Duplicate note: 86 remote roles accounted for 437 of the duplicate listings across city searches
- Skill map: WiseWorld PowerWheel: 44 soft skills in six groups
- How we counted each skill: We read the full job description and marked a skill as named when the text used matching words or phrases (for example, "own features end-to-end" counts as Accountability). Each skill is yes or no per post.
- City vs market charts: Market charts use 563 deduplicated jobs; city charts use all 100 posts per capital search
- Deep dives: Five capitals profiled on the PowerWheel (Berlin, Warsaw, Madrid, Paris, Amsterdam)
Four numbers that frame the rest of the story:
European software hiring headline statistics
Key numbers from the 563-post LinkedIn capture.
- 563: Unique job posts analysed
- 296: Employers in sample
- 44: Soft skills counted (WiseWorld PowerWheel)
- 81%: Posts naming Collaboration most often
Every percentage here describes public post language, not interview performance or whether candidates actually have the skill:
How to read this European software hiring study
Four-step guide for interpreting post counts and patterns.
- Post: Every number describes one public LinkedIn job post collected 1 July 2026. Not your scorecard, not the interview, not whether candidates actually have the skill.
- Pattern: We marked each of 44 PowerWheel skills yes or no per post. A high share means often named in the text, not most important once someone is in the role.
- Limit: Market charts use 563 deduplicated jobs; city charts use 100 posts per capital (including duplicates a job seeker would see locally). Agoda, Alignerr, and Turing posted heavily. We have no pre-2023 baseline from the same employers. Software vs pharma compares two separate captures.
- So what: Start with the PowerWheel counts, then how posts phrase delivery versus personality, how cities and company size change the mix, the pharma comparison, and the 168-post urgent slice from capture day. That last slice is one summer day, not proof the market shifted.
Topics in this article:
In this article
Table of contents for the European software soft skills study.
- What showed up in 563 job posts
- Employers write delivery, not personality
- Ten cities, ten personalities
- Company size, seniority, and contract shape the language
- Software vs pharma: same wheel, different shape
- What urgent hires look like
- Seven edits before your next hire
- Methodology
What showed up in 563 job posts
Once we started reading, a shape emerged quickly. For every full job description we asked a plain question: did this post name each of the 44 PowerWheel skills? "Collaborate with the product team" counts as Collaboration. "Own features end-to-end" counts as Accountability. A skill either appears in the text or it does not. We are measuring what employers write on the page, not how important each skill proves once someone starts the job.
Five patterns stood out before we opened any city or company breakdown:
Key findings from 563 European software job posts
Headline patterns from the PowerWheel analysis.
- Collaboration appears in four of five posts (81%), but Written Expression ranks only 14th (12%).
- Task Mastery (70%) and Accountability (61%) follow — delivery language, not personality labels.
- Conflict Resolution and Negotiation each appear in zero posts; Empathy in fewer than one in twenty-five (3.7%).
- Full-time posts name ownership in nearly two-thirds of cases (64%); contract posts, in about one in six (16%).
- Warsaw pushes Collaboration furthest on the PowerWheel (89% in that city's search); Amsterdam sits lowest on leadership language (19% category average).
The PowerWheel is the market's silhouette. Start with the full European view, then switch to Berlin, Warsaw, Madrid, Paris, or Amsterdam and watch the shape shift. The farther a skill sits from the centre, the more often that city's posts named it.
Figure 1: The European software market as a Reference PowerWheel
Interactive PowerWheel of 44 soft skills from 563 deduplicated posts. Switch between market average and five capitals.
- Collaboration: 80.8% of posts (455 posts)
- Task Mastery: 69.5% of posts (391 posts)
- Accountability: 61.1% of posts (344 posts)
- Flexibility: 60.2% of posts (339 posts)
- Dependability: 53.8% of posts (303 posts)
- Time Management: 38.7% of posts (218 posts)
- Initiative: 37.3% of posts (210 posts)
- Coaching: 36.4% of posts (205 posts)
Zoom out from individual skills and the story groups into six categories. Work Ethic leads at 30.6%, then Leadership at 22.2%. Communication sits lowest as a group at 2.3%, even though Collaboration ranks first on the wheel. Employers talk about delivery and ownership far more often than they label communication as its own headline skill.
Figure 1b: How soft-skill mentions divide across six categories
Average mention rate within each PowerWheel category across all posts.
- Work Ethic: 30.6%
- Leadership: 22.2%
- Teamwork: 19.1%
- Cognitive Abilities: 16.9%
- Problem Solving: 9.1%
- Communication: 2.3%
Drill back into the top fifteen skills by name and the same delivery story repeats. Collaboration ranks first at 81%, Task Mastery second at 70%, and Accountability third at 61%. Remember: a high share means often named in the post, not automatically most important on the job.
Top 15 PowerWheel skills in European software engineer job posts
Individual skills ranked by share of posts naming each at least once.
- Collaboration (Teamwork): 80.8%, 455 posts
- Task Mastery (Work Ethic): 69.5%, 391 posts
- Accountability (Leadership): 61.1%, 344 posts
- Flexibility (Cognitive Abilities): 60.2%, 339 posts
- Dependability (Work Ethic): 53.8%, 303 posts
- Time Management (Work Ethic): 38.7%, 218 posts
- Initiative (Leadership): 37.3%, 210 posts
- Coaching (Leadership): 36.4%, 205 posts
- Independence (Leadership): 34.5%, 194 posts
- Creative Thinking (Problem Solving): 26.3%, 148 posts
- Inductive Reasoning (Cognitive Abilities): 21.3%, 120 posts
- Critical Thinking (Cognitive Abilities): 21.1%, 119 posts
- Written Expression (Communication): 12.1%, 68 posts
- Objective Setting (Leadership): 11.7%, 66 posts
- Active Learning (Cognitive Abilities): 10.8%, 61 posts
At the far edge of the wheel sit the skills employers almost never write down. Conflict Resolution, Negotiation, and Persuasion each show up in zero listings. Low mention often means assumed, not optional. If your team lives on those moments, the post may be leaving the hard part unstated.
Skills named in fewer than 2% of posts (the quiet ring)
PowerWheel skills employers rarely write into job posts.
- Public Interaction: 0%
- Learning Strategies: 0%
- Negotiation: 0%
- Persuasion: 0%
- Conflict Resolution: 0%
- Health Oversight: 0%
- Time Sharing: 0%
- Team Development: 0.5%
- Active Listening: 0.2%
- Fluency of Ideas: 1.2%
What the wheel is really saying
What collaboration, delivery language, and the quiet ring signal in EU software posts.
- The hidden profile is a dependable collaborator.
- Employers write delivery language, not communication labels.
- The quiet ring is almost entirely interpersonal friction.
Employers write delivery, not personality
Collaboration sits at the centre of the wheel for a reason, and the wording explains it. Employers rarely ask for a personality type. They describe a week of work: collaborate with the team, ship the feature, own the outcome, adapt when priorities shift. Written Expression and other communication skills sit much further out. The post reads as though engineers already know how to explain themselves. Most of the words go to whether you can deliver.
That choice shows up line by line. Teamwork is something you do, not a trait you are born with. Posts ask for results: own end-to-end, ship, measure impact. "Strong" and "excellent" still appear in front of many skills, but rarely with a sentence that says what good looks like on week two. Plain labels like "team player" are almost gone, yet the replacement is often still a mood, not a move.
How employers phrase soft skills in job posts
Share of posts using strength words, action phrasing, and legacy labels.
- 71%: Posts using "strong" or "excellent"
- 56%: Teamwork written as an action
- 39%: Delivery language ("ship", "own")
- 3%: Label "team player"
Six real lines from this sample map a vague phrase to the PowerWheel skills inside it and a standard you could publish so a candidate can picture the job.
Figure 3: Real lines from posts in this sample, the skills they point to, and the standard behind them
Vague post language mapped to PowerWheel skills and concrete year-one standards.
- Strong communicator with excellent teamwork skills and a collaborative mindset. → Collaboration, Written Expression
- Own features end-to-end from shipping to measuring impact. → Accountability, Task Mastery
- Comfortable working in a fast-paced environment with changing priorities. → Flexibility, Time Management
- Proven ability to work independently with minimal supervision. → Independence, Initiative
- Collaborate closely with cross-functional teams including product and design. → Collaboration, Coordination
- Passionate team player who thrives in dynamic startup environments. → Collaboration, Dependability
Career coaches still tell people to lead with communication and teamwork. In this sample, posts lead with delivery: who you work with, what you ship, what you own. Communication is folded into those lines rather than named as the headline skill. A candidate who prepares from generic coaching may rehearse the wrong story entirely.
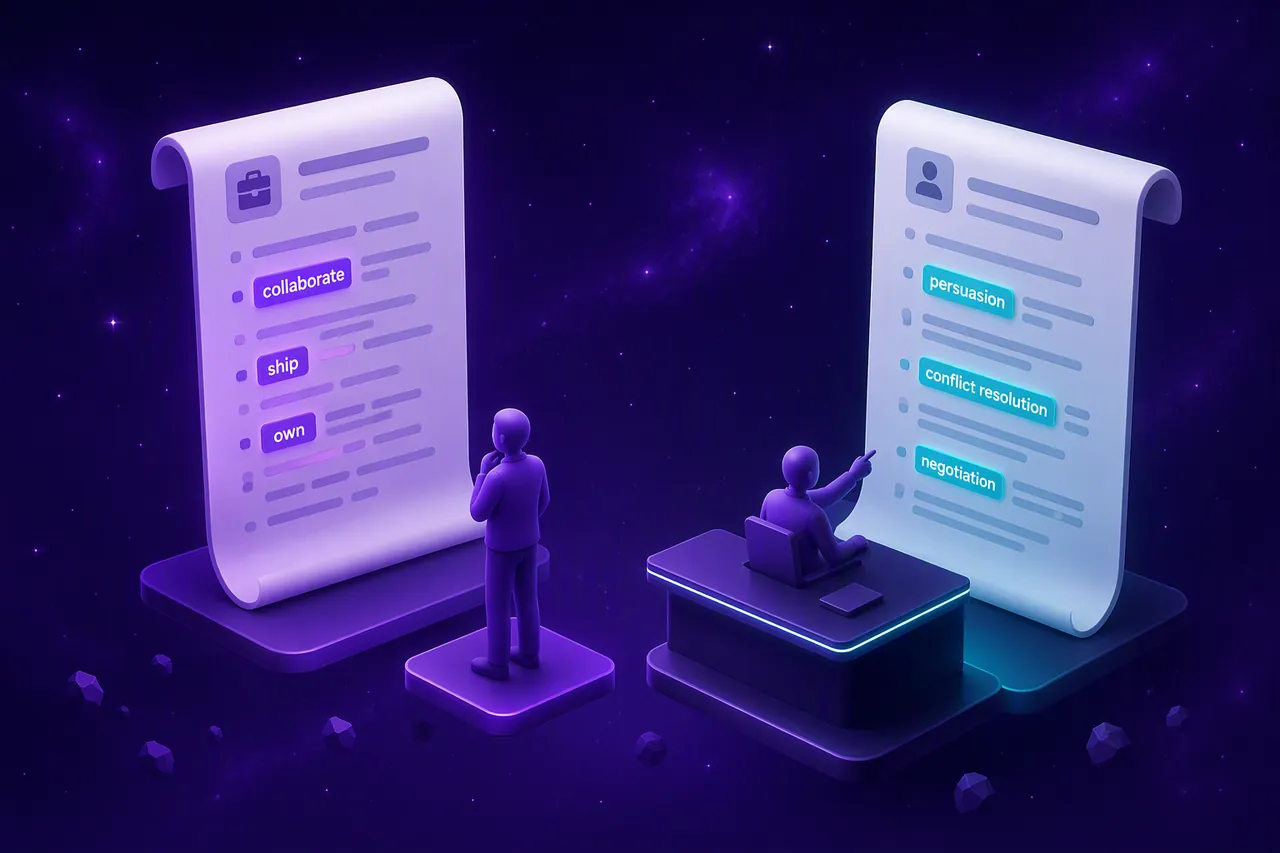
We compared the public post to what interviewers often score behind the scenes. We read 40 public templates from Greenhouse, Lever, and Ashby. We did not sit in on live interviews. Collaboration and Accountability show up often in posts. Conflict Resolution, Negotiation, and Persuasion barely appear in posts but still show up on many scorecard templates. Candidates prepare from the post. Interviewers grade from the template. Nobody agreed which script was the real one.
Figure 3b: What posts name vs what scorecard templates score
Left bar: share of 563 posts. Right bar: emphasis in 40 public TA templates (not live interviews).
- Written Expression: 12.1% in job posts; scorecard emphasis High
- Collaboration: 80.8% in job posts; scorecard emphasis High
- Conflict Resolution: 0% in job posts; scorecard emphasis High
- Negotiation: 0% in job posts; scorecard emphasis High
- Persuasion: 0% in job posts; scorecard emphasis Medium
- Accountability: 61.1% in job posts; scorecard emphasis Medium
- Active Learning: 10.8% in job posts; scorecard emphasis Medium
What the wording is hiding in plain sight
Handoffs, strength words, and scorecard traps in delivery-focused posts.
- The useful detail is in the handoff.
- Strength words replace standards.
- Do not let one story fill four score boxes.
Ten cities, ten personalities
A European average is a useful starting point and a misleading finish. The same job title reads like a different brief from one capital to the next. Teamwork leads everywhere, in at least seven in ten posts per city (70%), but leadership language spreads from 33% in Amsterdam to 54% in Berlin. That spread is the story: not one market, but ten local dialects of the same role.
Those dialects show up as different shapes on the PowerWheel. Five capitals sit against the market average within each skill category. Madrid runs warmest on leadership (25%); Amsterdam stays coolest (19%). Switch capitals in the market PowerWheel to see individual skill spikes by city.
Figure 2b: Five capitals, five PowerWheel shapes
Average skill mention rate within each category (Berlin, Warsaw, Madrid, Paris, Amsterdam vs market).
- Berlin: Teamwork 18.4%, Leadership 22.4%, Work Ethic 30.7%
- Warsaw: Teamwork 20.6%, Leadership 22.4%, Work Ethic 30.7%
- Madrid: Teamwork 20.0%, Leadership 25.0%, Work Ethic 29.8%
- Paris: Teamwork 18.8%, Leadership 20.9%, Work Ethic 27.2%
- Amsterdam: Teamwork 20.6%, Leadership 19.0%, Work Ethic 29.8%
- All EU: Teamwork 19.1%, Leadership 22.2%, Work Ethic 30.6%
Teamwork sits at a similar level in every city. Leadership is where the markets part ways. The heatmap lines up all ten capitals and three skills side by side: Collaboration, Leadership, and Ownership. Read across the Leadership row to rank cities. Read down one column to see how a single capital mixes delivery language with lead-the-work language. Berlin runs warm on leadership and ownership. Amsterdam stays cooler on leadership while collaboration holds steady.
Figure 2: Collaboration, leadership, and ownership by capital
Share of the 100 posts per city that name each skill at least once.
- Berlin: Collaboration 70%, Leadership 54%, Ownership 65%
- Warsaw: Collaboration 85%, Leadership 52%, Ownership 55%
- Madrid: Collaboration 76%, Leadership 46%, Ownership 63%
- Prague: Collaboration 74%, Leadership 44%, Ownership 52%
- Paris: Collaboration 71%, Leadership 41%, Ownership 47%
- Stockholm: Collaboration 73%, Leadership 37%, Ownership 57%
- Rome: Collaboration 70%, Leadership 36%, Ownership 49%
- Brussels: Collaboration 70%, Leadership 34%, Ownership 53%
- Vienna: Collaboration 70%, Leadership 34%, Ownership 46%
- Amsterdam: Collaboration 72%, Leadership 33%, Ownership 49%
The pattern tracks employer mix more than national character. Where large, office-based employers dominate, leadership language rises. Where remote startups dominate, posts still stress teamwork but name leadership less often. All ten cities side by side so you can match a candidate's home market to the voice they learned to write in.
All ten capitals, side by side
Collaboration, leadership, ownership, remote share, and median company size per capital.
- Brussels: Collaboration 70%, Leadership 34%, Ownership 53%, Remote 76%, median size 176
- Berlin: Collaboration 70%, Leadership 54%, Ownership 65%, Remote 18%, median size 1,437
- Paris: Collaboration 71%, Leadership 41%, Ownership 47%, Remote 62%, median size 525
- Rome: Collaboration 70%, Leadership 36%, Ownership 49%, Remote 97%, median size 194
- Madrid: Collaboration 76%, Leadership 46%, Ownership 63%, Remote 74%, median size 826
- Warsaw: Collaboration 85%, Leadership 52%, Ownership 55%, Remote 70%, median size 1,353
- Amsterdam: Collaboration 72%, Leadership 33%, Ownership 49%, Remote 74%, median size 194
- Vienna: Collaboration 70%, Leadership 34%, Ownership 46%, Remote 84%, median size 154
- Prague: Collaboration 74%, Leadership 44%, Ownership 52%, Remote 72%, median size 494
- Stockholm: Collaboration 73%, Leadership 37%, Ownership 57%, Remote 72%, median size 194
Ten capitals, three stories
Ownership vs leadership, CV style by market, and undefined collaboration.
- Where ownership outruns leadership, the job is responsibility without authority.
- The same experience reads differently on each CV.
- Everyone wants collaboration. Almost nobody defines how it works.
Company size, seniority, and contract shape the language
Open one of your own job posts and scroll to the soft skills section. Does the list grow because the role truly needs more, or because a template has been collecting lines for years? Company size turns out to predict list length almost as well as seniority. Mid-size firms with 501 to 1,000 staff write the longest lists, averaging 8.2 soft skills per post, often because HR teams reuse the same wording across many roles. The smallest firms average just 3.5. That brevity may reflect trust that new hires will pick things up on the job, not a lower bar.
Bigger companies write longer soft skill lists
Company size, post count, average skills per post, and most named skill.
- 501 to 1,000 employees: 71 posts, 8.2 skills/post, Collaboration 83%
- 1,001+ employees: 272 posts, 6.7 skills/post, Collaboration 79%
- 201 to 500 employees: 54 posts, 6.4 skills/post, Ownership 69%
- 51 to 200 employees: 81 posts, 4.8 skills/post, Collaboration 61%
- 11 to 50 employees: 59 posts, 4.4 skills/post, Collaboration 61%
- 1 to 10 employees: 26 posts, 3.5 skills/post, Collaboration 62%
Length is only the first chapter. Figure 3 asks which skills move with headcount. Collaboration sits near six in ten posts for firms under 200 staff, then rises sharply in the mid-size band. Ownership and leadership follow the same curve: quiet in the smallest companies, much louder once headcount passes a few hundred. A three-skill post at a ten-person startup and an eight-skill post at a 600-person firm are often describing different kinds of work on the page, not a longer template list.
Figure 3: Soft skills by company size
Collaboration, ownership, and leadership across headcount bands.
- 1-10 staff: Collaboration 61.5%, Ownership 30.8%, Leadership 26.9%
- 11-50: Collaboration 61%, Ownership 54.2%, Leadership 23.7%
- 51-200: Collaboration 60.5%, Ownership 53.1%, Leadership 30.9%
- 201-500: Collaboration 64.8%, Ownership 68.5%, Leadership 51.9%
- 501-1K: Collaboration 83.1%, Ownership 78.9%, Leadership 64.8%
- 1,001+: Collaboration 79%, Ownership 53.3%, Leadership 55.1%
Where people work rewrites the brief too. Remote posts spell out teamwork more often than on-site posts, as if employers know they must describe collaboration when nobody shares a hallway.
Figure 4: Remote, hybrid, and on-site ask for different things
Share of posts in each work setup that name the skill.
- Remote: Collaboration 74.4%, Communication 57.3%, Adaptability 59.2%, Ownership 52.7%
- Hybrid: Collaboration 77.3%, Communication 49.6%, Adaptability 54.6%, Ownership 62.4%
- On-site: Collaboration 48.3%, Communication 41.4%, Adaptability 39.7%, Ownership 48.3%
Now picture a graduate reading an entry-level post. Do you ask them to lead? Lead and principal roles ask for leadership in more than four in five posts (84%). Entry-level roles lean on adaptability, the language of learning fast. Grouped by job title on LinkedIn, posts shift with the name on the door:
The job title predicts the soft skills. Junior rows may match programme names (e.g. leadership development) rather than role requirements.
Top three named skills by job title group in the sample.
- Lead / Principal / Staff: Collaboration 86%, Leadership 84%, Creativity 77%
- Senior Software Engineer: Collaboration 74%, Ownership 69%, Inclusion 60%
- Software Engineer (general): Collaboration 71%, Adaptability 52%, Work ethic 52%
- Junior / Graduate: Creativity 86%, Leadership 79%, Collaboration 68%
- DevOps / Platform / SRE: Work ethic 73%, Adaptability 60%, Ownership 60%
- Director level: Work ethic 94%, Communication 89%, Ownership 83%
Figure 5 tells the same story through years of experience on LinkedIn. Ownership climbs from entry to director. Leadership is patchier: it dips in associate posts even though lead titles name it often. Collaboration stays high early, softens in the middle, then steadies at the top. Learning agility runs the other way, strongest in entry posts and rare by director level. If the junior leadership figure in the title table surprised you, read the asterisk: many of those lines come from programme names, not role requirements. Figure 5 is the cleaner read when you are benchmarking by seniority.
Figure 5: Seniority changes the language
Share of posts at each level that name collaboration, leadership, ownership, and learning agility.
- Entry: Collaboration 86%, Leadership 41.9%, Ownership 55.8%, Learning agility 23.3%
- Associate: Collaboration 79.7%, Leadership 31.9%, Ownership 42%, Learning agility 15.9%
- Mid-Senior: Collaboration 66.7%, Leadership 47.5%, Ownership 58.2%, Learning agility 14.2%
- Director: Collaboration 72.2%, Leadership 55.6%, Ownership 83.3%, Learning agility 11.1%
Contract type splits the market in a way that is easy to miss until you sit across from two finalists with the same title and different employment types. Full-time and contract posts ask for teamwork at the same rate, but ownership appears in nearly two-thirds of full-time posts (64%) and only about one in six contract ones (16%). Contract posts ask instead for problem solving and the ability to work alone. Same word on the org chart, different story on the page.
Figure 6: Full-time versus contract
Share of posts in each employment type that name the skill.
- Full time Teamwork: 73.5%; Contract: 73.2%
- Full time Ownership: 63.9%; Contract: 15.9%
- Full time Communication: 51.3%; Contract: 59.8%
- Full time Problem solving: 27.6%; Contract: 42.7%
- Full time Independence: 29.5%; Contract: 41.5%
- Full time Adaptability: 50.6%; Contract: 63.4%
How the same skill changes shape
List length, remote teamwork, and contractor vs permanent assessment.
- Longer posts do not always mean harder jobs.
- Remote roles need clearer teamwork instructions.
- Contractors and permanent hires are not the same story.
Software vs pharma: same wheel, different shape
Software posts talk about shipping and owning features. Pharma posts talk about sponsors, quality teams, and external partners. Same 44-skill PowerWheel, different brief about what the job actually is.
We put European software next to pharma on the same 44-skill map, using identical keyword rules on 4,920 pharma posts from large employers. This is method, not marketing copy: two captures, one counting lens.
Software posts over-index on delivery language. Task Mastery and Dependability sit well above pharma rates, alongside Collaboration and Flexibility. That matches the delivery pattern in the 563 software posts.
Pharma posts over-index on stakeholder-facing skills: External Relations, Coordination, Enterprising, and Objective Setting. Software posts barely name those. The gap is not that one industry cares about people and the other does not. Pharma makes the outside world explicit. Software often treats the product team as the whole story.
Figure 7 shows the eight skills where the two sectors diverge most. Read it as two hiring scripts sitting side by side, not a scorecard of which sector writes better posts.
Figure 7: European software vs pharma job posts
Same 44-skill PowerWheel on 563 EU software posts and 4,920 pharma posts. Eight largest gaps shown.
- Task Mastery: EU software 69.5%, pharma 20.8%
- External Relations: EU software 2%, pharma 47.3%
- Dependability: EU software 53.8%, pharma 15.2%
- Coordination: EU software 6.2%, pharma 33.3%
- Enterprising: EU software 4.1%, pharma 28.1%
- Flexibility: EU software 60.2%, pharma 37.3%
- Objective Setting: EU software 11.7%, pharma 33.5%
- Health Oversight: EU software 0%, pharma 19.6%
The table ranks the ten widest gaps. Task Mastery and External Relations sit at opposite ends: software spells out how work gets done; pharma spells out who the work is for. If you hire engineers into regulated or client-facing roles, do not assume the market template already names that part of the job.
Ten largest PowerWheel gaps between EU software and pharma posts
Percentage-point difference between sectors on the same skill.
- Task Mastery: software 69.5%, pharma 20.8% (-48.7 pp)
- External Relations: software 2%, pharma 47.3% (+45.3 pp)
- Dependability: software 53.8%, pharma 15.2% (-38.6 pp)
- Coordination: software 6.2%, pharma 33.3% (+27.1 pp)
- Enterprising: software 4.1%, pharma 28.1% (+24.0 pp)
- Flexibility: software 60.2%, pharma 37.3% (-22.9 pp)
- Objective Setting: software 11.7%, pharma 33.5% (+21.8 pp)
- Health Oversight: software 0%, pharma 19.6% (+19.6 pp)
- Collaboration: software 80.8%, pharma 62.8% (-18.0 pp)
- Inductive Reasoning: software 21.3%, pharma 5% (-16.3 pp)
Two industries, two hiring stories
Delivery vs stakeholder language, shared collaboration label, regulated engineering gaps.
- Software posts teach delivery. Pharma posts teach stakeholders.
- Collaboration is high in both, but it points to different work.
- Regulated or client-facing engineering needs extra lines.
What urgent hires look like
On the morning we captured the data, 1 July 2026, 168 of 563 unique posts had gone live in the previous twenty-four hours. That band is the slice of roles employers were rushing to fill that day. We compare it with the full sample. It is not a before-and-after test over months. It is a photograph of what freshly posted jobs looked like on one summer day.
Two shifts jump out immediately. Remote roles rise from 47% of the full sample to 58% of the urgent band. Contract roles rise from 15% to 31%. In this capture, fast hiring looked more like remote contract staffing than permanent local hiring. Figure 8 shows the workplace split.
Figure 8: Urgent posts skew remote
168 posts from the last 24 hours compared with the full 563-post sample.
- Remote: 58% urgent band vs 47% full sample
- Hybrid: 21% urgent band vs 25% full sample
- On-site: 8% urgent band vs 10% full sample
The skills named follow that split. In the urgent band, remote posts stress independence and problem solving. Hybrid and on-site posts stress ownership and work ethic. Figure 9 compares the two groups. If your role is remote and urgent, candidates will read a different brief than for a local permanent hire, even when the title matches.
Figure 9: Skills shift with workplace setup
Within 168 urgent posts: remote (97) vs hybrid or on-site (71).
- Independence: remote 51%, hybrid/on-site 29%
- Problem solving: remote 42%, hybrid/on-site 27%
- Ownership: remote 41%, hybrid/on-site 59%
- Work ethic: remote 55%, hybrid/on-site 67%
- Collaboration: remote 69%, hybrid/on-site 78%
- Leadership: remote 43%, hybrid/on-site 53%
What the last twenty-four hours looked like
Urgent hiring snapshot from 1 July 2026 capture, not a trend line.
- Fast hiring in this sample looks like remote contract work.
- Remote urgent posts and local urgent posts ask for different things.
- Treat this as a snapshot, not a trend line.
Seven edits before your next hire
Collaboration and delivery language dominate the PowerWheel. City, company size, and contract type change the mix. Posts often skip conflict skills that scorecards still grade. Fresh urgent roles skew remote and contract. Seven edits to pressure-test your own posts and interviews against those patterns.
They come from public LinkedIn text only. We did not run a hiring-outcomes experiment and we cannot see your internal scorecard. Treat them as a checklist to pressure-test what you publish and what you assess.
Seven edits before your next hire
Editorial recommendations for European software job posts and interviews.
- Pick the three behaviours that decide year one. Do not start with a long skill list. Ask the hiring manager which three moments will make this hire succeed or fail in the first year. Those moments are your priorities.
- Turn each behaviour into a work situation. Replace "strong communicator" with the actual moment: write a decision after a meeting, explain a blocker before standup, or hand work to another team. A candidate should be able to picture the job.
- Say what collaboration looks like here. Most posts ask for collaboration. Few explain it. Name who this person works with, what they hand over, and how decisions get made. "Work with product and design" is not enough on its own.
- Explain ownership before you ask for it. Ownership can mean "make the call," "keep the work moving," or "be accountable for the result." State which one you mean, and what the person may decide without asking for permission.
- Name the hard part, not just the smooth part. If the role involves conflicting priorities, a difficult stakeholder, or a broken handoff, put that in the post. Those are often the moments that decide success, yet they are almost absent from the listings we read.
- Match the post to the work setup. Remote, on-site, contract, and permanent roles do not ask for the same things. A remote contractor may need a clear scoped outcome and ways to unblock themselves. A permanent local hire may need to own work over time.
- Use the same evidence in the interview. For every behaviour in the post, write one question or exercise that shows it. If the post promises that ownership matters, ask for a real example of carrying a result, not a generic leadership rating.
A clearer post only helps if the interview tests the same work. The gap we saw most often is not missing skills on the page. It is asking interviewers to score broad labels the post never defined.
WiseWorld's take: the market moved on, hiring did not
Job posts describe delivery actions; many scorecards still rate broad communication and teamwork labels. Close the gap by assessing the same behaviours the post describes.
- Posts describe what a person will do: collaborate, own a feature, adapt when priorities shift.
- Scorecards still ask interviewers to rate communication or teamwork on a 1–5 scale without defining good.
- Close the gap by assessing the same behaviours the post describes, in the same pairs the post bundles them.
Further reading
Related WiseWorld research on pharma posts, behavioral assessment, cheat-proof screening, and hiring funnel gaps.
- Soft skills in pharma job posts: what 126 pharma companies actually ask for (4,920 posts, 44-skill map)
- Pre-interview behavioral assessment guide: see how they use the skills the post names, as they do the job
- Cheat-proof soft skills assessment research: validity, completion rates, and prep risk when candidates use ChatGPT
- Six hiring funnel gaps research: why phone screens, personality tests, and AI video land in the same broken step
- How to assess candidates after AI resume screening: post-GenAI workflow and evidence tables after qualification
- Phone screen vs self-paced screening: cost, completion, and validity by method
Methodology
- Data source. Job postings collected from LinkedIn on July 1, 2026, searching for "software engineer" roles in Brussels, Berlin, Paris, Rome, Madrid, Warsaw, Amsterdam, Vienna, Prague, and Stockholm.
- Sample. 1,000 postings collected, 100 per city. After deduplicating by job ID (the same role can appear in multiple city searches), 563 distinct jobs remained, from 296 companies. Posting dates ranged from June 12 to July 1, 2026.
- Deduplication. A single remote role can be listed in many cities. Counting it once per city would let a few widely posted roles dominate the skill rates. Counting each job once describes what employers are asking for, not how the search engine surfaces listings.
- Primary coding. WiseWorld PowerWheel (44 soft skills). Keyword patterns applied to full job description text; each skill marked yes or no per post.
- Legacy 20-category tables. Same taxonomy as our pharma study for cross-industry comparison charts.
- Interview gap chart. PowerWheel skill shares come from this sample. Scorecard emphasis (High / Medium / Low) reflects a review of 40 public structured interview templates from Greenhouse, Lever, and Ashby job kits in July 2026.
- Company data. Employee count, headquarters location, industry, and work setup drawn from LinkedIn company profiles.
- Reporting rule. Aggregate results use the 563 distinct jobs. City-by-city results use all 100 posts per city, to reflect what a job seeker searching in that city would see.
- Limits. English-language posts only; phrase matching can miss implied skills; the sample covers software engineering only and is not representative of all industries or countries.
Download PowerWheel skill rates
CSV with 44-skill framework rates for 563 deduplicated posts at /data/european-powerwheel-skills.csv.
- File: /data/european-powerwheel-skills.csv
- 44 WiseWorld PowerWheel skills with post counts and shares
- 563 deduplicated LinkedIn software engineer posts, ten European capitals, July 2026
Common questions about soft skills in European software job posts
Frequently asked questions about EU software hiring language and the PowerWheel.
- What soft skills appear most in European software engineer job posts? Collaboration appears in 81% of posts, followed by Task Mastery (70%), Accountability (61%), Flexibility (60%), and Dependability (54%). Written Expression ranks 14th at 12%. Based on WiseWorld PowerWheel analysis of 563 unique LinkedIn job posts across ten European capitals (July 1, 2026).
- What is the WiseWorld PowerWheel? The WiseWorld PowerWheel is a map of 44 soft skills in six groups: teamwork, communication, thinking skills, work ethic, problem solving, and leadership. Each job post is checked against all 44 skills; the chart shows how often employers named each one.
- Do job posts match what interviews actually test? Often no. Conflict Resolution and Negotiation appear in zero posts in this sample. On 40 public scorecard templates we reviewed, both still appear as scored criteria. We did not observe live interviews; this compares post language to template language. Candidates prepare from the post, not the template.
- Which European city mentions leadership most in tech job ads? Berlin leads the ten capitals studied, with leadership language in 54% of software engineer posts. Amsterdam is lowest at 33%. Collaboration appears in at least 70% of posts in every city.
- Can I download the underlying data? Yes. A CSV with PowerWheel skill rates for all 563 deduplicated posts is available at /data/european-powerwheel-skills.csv. Legacy 20-category topline data is at /data/soft-skills-european-hiring.csv.
More in Recruitment



Latest on the blog